Estimated reading time: 5 minutes
A comprehensive overview of what Power BI is, explaining its capabilities for transforming data into actionable insights for businesses.
Businesses are always seeking efficient ways to visualize and interpret their data in today’s data-driven world. Enter power BI, a transformative data visualization tool developed by Microsoft. This article will delve into Power BI’s features and benefits, showcasing how it can empower you to turn your business data into actionable insights.

Power BI: What is it?
Power BI is a set of software, apps and connectors that combine to transform unrelated data into interactive, visual and immersive insights. Power BI allows you to connect easily with your data, whether it’s an Excel spreadsheet, a hybrid cloud, or an on-premises data warehouse. You can then visualize, discover, and share the most important information.
Power BI: Critical Components
Power BI consists of a number of components that allow for a robust experience in data analysis:
Power BI Desktop is a downloadable application that allows users to connect, transform and visualize data. It is a primary tool for creating data models and reports.
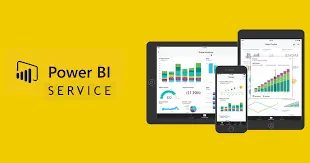
Service Power BI:
A cloud-based platform where users can collaborate and manage their reports and data.
PowerBI Mobile:
Mobile applications for iOS, Android and Windows devices that allow users to interact with reports and data on the move.
Report Builder: This tool allows you to create paginated reports that can be printed or shared in PDF format.
Report Server Power BI – An on-premises server for storing and managing your reports and data.
How Does Power BI Work?
Power BI is divided into three major steps:
Data Connection:
Power BI can connect to a variety of data sources, ranging from simple Excel spreadsheets to complex databases, as well as online services such as Google Analytics, Salesforce and Microsoft Azure. It can combine data from different sources into one dashboard.
Power Query allows users to clean, merge and shape data according to their requirements. This step will enable you to sort, filter and transform your data into usable formats.
Data Visualization Power BI provides a wide range of data visualization tools, including bar charts, pie graphs, line graphs and maps. These visuals can help you identify trends, patterns and outliers in your data.
Why use Power BI? Power BI: Benefits for Business
Power BI is a powerful tool for business intelligence and data visualization.
With its drag-and-drop user interface and intuitive design, Power BI ensures a stress-free experience for both beginners and professionals. It’s a breeze to create stunning dashboards and reports, making data visualization a comfortable task for all.
Flexibility:
Power BI is scalable to meet the needs of your business. It can accommodate small businesses and large enterprises, even those with huge datasets.
Real-Time Data Analysis:
Power BI’s real-time data analysis provides companies with up-to-date insights to help them make better decisions.
Sharing and Collaboration:
You can share dashboards and reports with your team to enable collaborative decision-making.
Power BI is not just a powerful tool, it’s also budget-friendly. With free and affordable versions available, it’s a cost-effective solution for businesses of any size, providing reassurance that you can harness the power of data without breaking the bank.
Use Cases for Power BI
Power BI can be used in a wide range of industries and to meet a number of data visualization needs.
Finance: Monitor important financial metrics, visualize your cash flow, and forecast revenue.
Marketing: Analyze customer data, track campaign performance, and monitor website analytics.
Sales: Track conversion rates and evaluate sales pipelines.
Operation: Optimize supply chain processes, monitor inventories, and track project performances.
Getting started with Power BI
Power BI Desktop can be downloaded from Microsoft’s official website. You can learn more about the tool by using online courses and tutorials. Connect to a DataSource and experiment with the various visualization options before creating your first report.
PowerBI vs. other BI tools
Power BI is a leader in the field of business intelligence, but it’s important to compare it to other tools like Tableau, Qlik, and Google Data Studio. Each tool has its unique features and benefits, so it’s essential to evaluate which one will work best for your company. Power BI stands out for its user-friendly interface, seamless integration with Microsoft products, and affordability.
Frequently Asked Questions (FAQs)
Answer: Power BI does offer a basic version for free, which is a great starting point for many users. However, for more advanced features and capabilities, you’ll need to upgrade to the Pro or Premium versions, which come with a subscription fee.
2. Can I use Power BI on my mobile device?
Answer: Yes, Power BI Mobile can be downloaded to iOS, Android, and Windows devices.
3. What data sources can Power BI use?
Answer: A Power BI can be used to access data from many sources, including Excel, SQL servers, Azure, Google Analytics, and more.
You’re now ready to explore PowerBI and learn how it can turn your business data into useful insights. Try it out and bring your data analysis skills to the next stage!
You’re now ready to explore PowerBI and learn how it can turn your business data into useful insights. Try it out and bring your data analysis skills to the next stage!
Conclusion
Power BI can be a valuable tool for companies that want to use their data to make better decisions. Power BI’s robust features, seamless integration abilities, and affordable price make it ideal for businesses of any size. Power BI is the perfect tool for anyone who wants to make confident data-driven decisions, whether they are new to data visualization.